30 November 2021
What maps tell us about how we live, work and travel
Complex patterns in geographic data and maps can tell us much about our lives today and in the future. This article “What maps tell us about how we live, work and travel” by Jesko Zimmermann, David Meredith and Rob O’Hara, Teagasc, first appeared on RTÉ Brainstorm.
The concept of place is a fundamental part of our day-to-day lives: everything happens somewhere! It’s not surprising that an entire field of geographical science has developed around place and the interactions between distinct places. Understanding the distribution of housing and population, the location of jobs and the journeys to work, school and college and the risk of isolation are important pieces of basic knowledge underpinning research at Teagasc focused on social, economic and environmental sustainability.
For several years, we have been visualising complex patterns in geographic data and publishing them as online maps as part of our monthly map series. Here, we take a closer look at the patterns around where we live and where we go to work. Whether you live to work or work to live, it all happens within a geographic space. So what do these spaces look like? What patterns are hidden in the data? What can they tell us about how we live/work now and may live/work in the future?
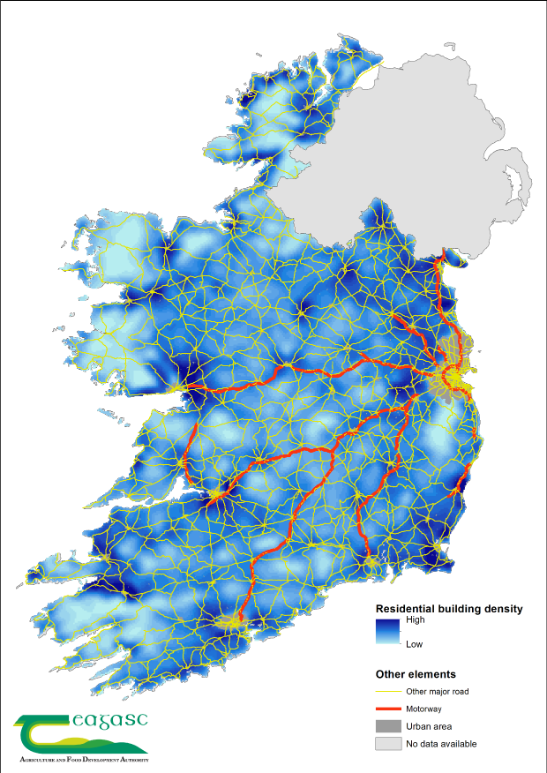
This map above shows the density of residential buildings in rural Ireland. The road network represents all named national roads.
The first major distinction that comes to mind is the urban/rural divide. There has been a sustained movement of population from the countryside into urban areas over the last 30 years. Recent data suggests 63.5% of our population live in towns or cities. In 2016, the Central Statistics Office calculated there were nearly 617,000 permanent residential dwellings in rural areas (see dataset E1068 in the CSO PxStat service).Housing in rural areas takes a variety of forms. It can range from sprawling housing estates on the edge of towns and villages, to ribbon development along our road network, to lonely cottages looking out at that seas that surround us. Most rural housing is classified as ‘one-off’ houses. These are defined as occupied detached houses with individual sewerage systems. The CSO classified over 442,000 houses (nearly 70% of all rural housing) as ‘one-off’ houses in 2016.In a recent map, we examined rural housing density in Ireland. The map was based on Ordnance Survey Ireland’s Prime2 geospatial database. This is a digital reflection of real world objects; fields, rivers, roads, buildings etc. The map shows residential housing density within a moving 1 km2 window and shows clear patterns in rural housing density.
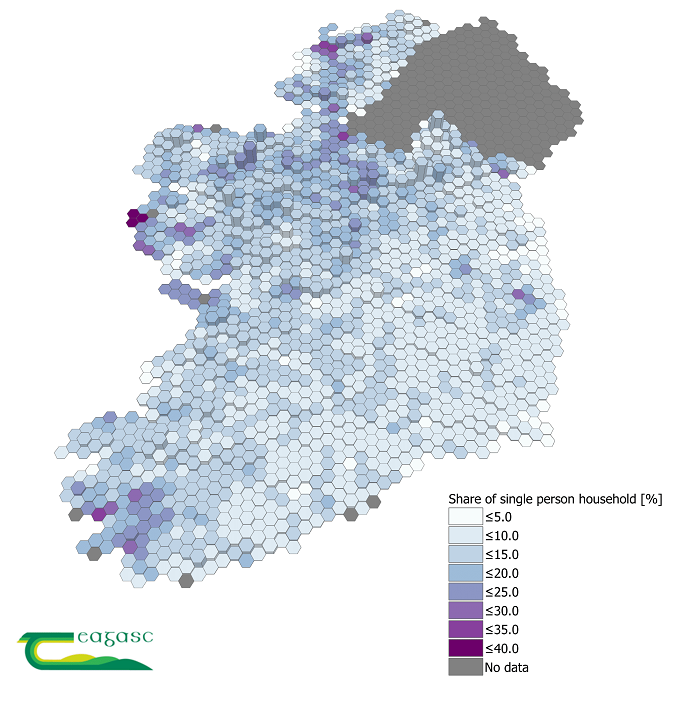
There is a strong geographical trend with the highest instances of people living alone occurring in the west of Ireland
Our analysis established that average density stands at 7.2 houses per km2, but there is substantial variation over space. We see high concentrations of housing around major urban centres as expected. There are also pockets of high density around smaller centres countrywide but particularly in the “commuter belts” around our cities. For example, some of the highest density rural housing in the country is around Claregalway, Co. Galway. Extensive development between towns and along the national road networks are also evident. Upland and marginal areas are notable in the low density of housing.
How does our housing distribution and density impact the way we live? We explored such implications in other maps. Commuting into larger towns and cities from the countryside has long been a part of rural living, be it for work, socialising or education. With the return to workplaces earlier this year following the easing of pandemic restrictions, we took a look at the pre-pandemic commuting directions.
Our map show how both small and large urban centres attract large numbers of people from their hinterlands like magnetic poles. In an earlier map, we showed that commuter belts have developed especially around the larger cities, with up to 40% of populations in electoral divisions commuting for at least 45 minutes.
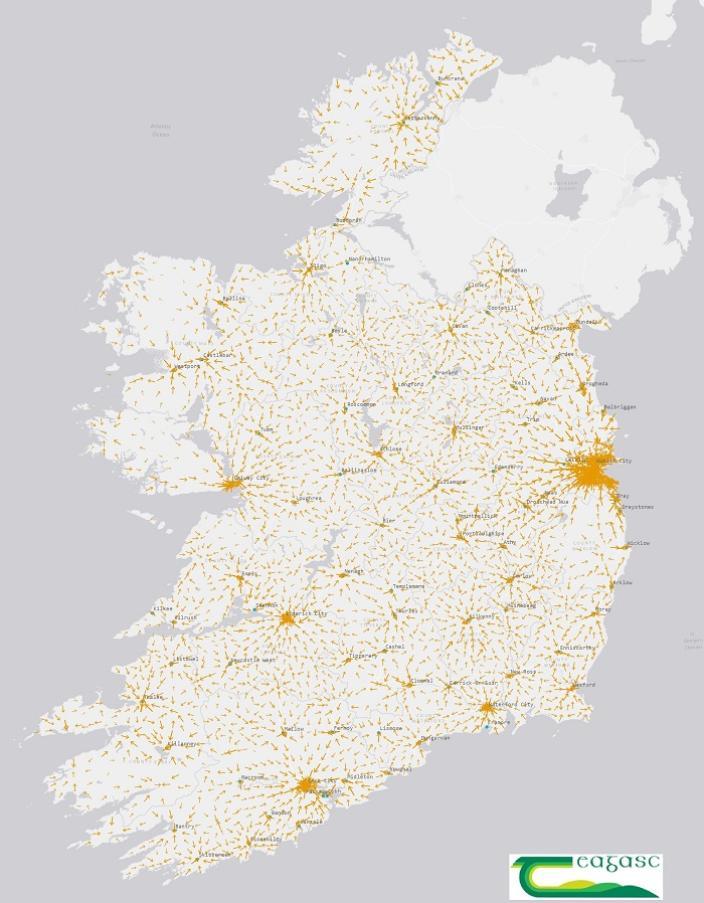
The map above shows the main cardinal direction of commuters in each electoral division.
We also considered another important aspect of rural living, isolation. Social distancing became a buzzword over the last two years. However, isolation is an ever present issue in rural areas, and one which has been shown to have detrimental effects on both physical and mental health. A range of factors influence whether a person may suffer from isolation and while geography is a small but important aspect of isolation, other factors include individual and socio-economic group characteristics.
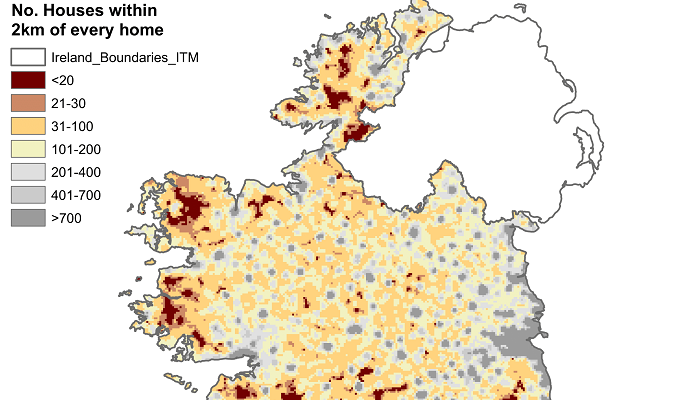
We have looked at two aspects driving isolation, the number of people living alone (characterised as singe-person households in the census of population data), and the density of houses with no other dwelling within a 2km radius. While neither of these maps is a direct indicator of how isolated a person may feel, living alone and being distant from socio-cultural, economic and public services can contribute to feeling isolated.
More importantly, as these maps show, there is a strong geographical trend with the highest instances of each occurring in the west of Ireland. Generally the geographic patterns correspond with remote and poorly accessible areas, such as mountainous regions and the islands.
This map above shows the share of single farm households relative to the total number of farms within each hexagon. The height of the hexagon provides an indication of the number of farms.
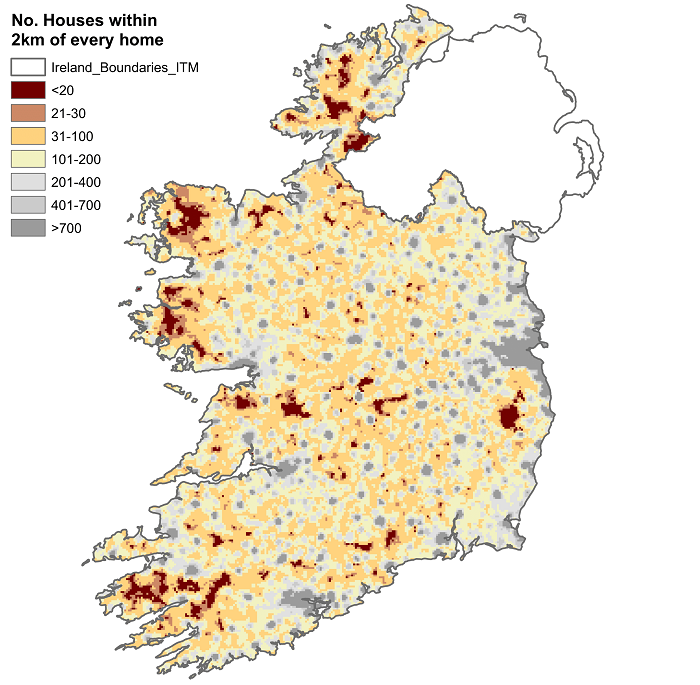
This map above shows the number of houses that are within a 2km range of another house.
Ireland’s demographics and how we live, work and travel will always change over time. Regular census data analysed spatially and visualised clearly will play a key role in our understanding of the complex social and economic patterns that are present.
Dr Jesko Zimmermann is a Data Technologist in the Agrifood Business and Spatial Analysis Department at Teagasc. Dr David Meredith is a Senior Research Officer at the Rural Economy & Development Programme at Teagasc. Dr Rob O’Hara is a Research Officer with Teagasc and Terrain-AI.
This article first appeared on RTÉ Brainstorm. See Link to original article: https://www.rte.ie/brainstorm/2021/1123/1262686-ireland-maps-geographic-data-houses-travel-work/
Read more on these and other fascinating maps produced by Teagasc at GIS Monthly Maps