13 December 2023
How good is your silage this winter?

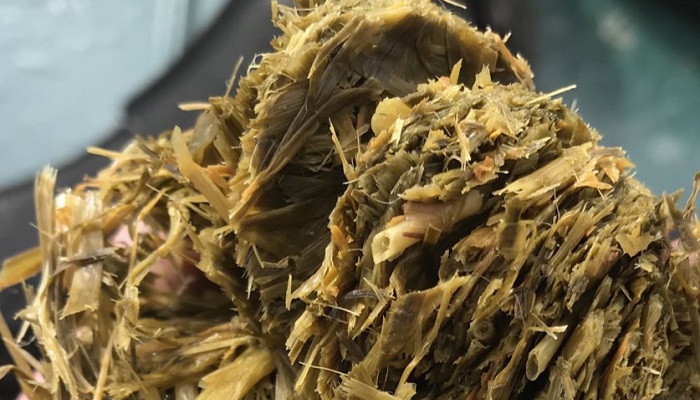
Testing your silage is a good investment that will provide you with the true feed value of your winter forage, writes Ciaran Lynch, Teagasc Sheep Specialist.
This, along with pregnancy scanning results, should form the basis of winter-feeding plans and allow you to tailor concentrate supplementation to avoid under or overfeeding. With high concentrate prices, you may be able to reduce the amount used where high feed value silage is available, so this task should be completed on time. On many farms this year, there is likely to be multiple cuts, so allocate the best-quality forage to ewes in late pregnancy.
It’s important to get a representative sample of the silage made during the past season. Where multiple cuts were made, particularly in the case of bales, these will require more samples to get a proper picture of quality.
Sampling should be based on cutting date and silage type – i.e. surplus paddocks versus longer closed silage ground, or first versus second cut.
Correct sampling procedure
To get the most out of your silage analysis, it’s important that the sample is taken correctly. Firstly, contact your local Teagasc office to arrange getting a silage test conducted using a core sampler. The core sampler will be necessary to aid in the process, as it is unlikely all batches are being fed out when the sample is being collected. Although not an issue at present, keep in mind that should you wish to complete this process earlier in the coming seasons, a period of 5-6 weeks should elapse between ensiling and sampling.
For pit silage, take 3 to 5 full depth cores in a ‘W’ pattern across the pit, sealing any puncture holes in the plastic once sampling is complete. The multiple collection points will provide a more representative picture of the variation in forage quality that occurs from different fields harvested. Where taking samples from the open face of a pit, ensure that these are at minimum from a depth of 6 to 9 inches in from the feed face.
For baled silage, collect separate silage samples per batch as needed, ideally taken from 2-3 bales from each batch. Again as per the pit, sampling a deep core from each of these bales will give a representative sample.
Whether from bales or pit, once the silage core is collected, mix these thoroughly (within batch) and divide them into 0.5kg samples and place these into a clean sealable plastic bag – provided by the designated laboratory in most cases. Complete any accompanying information sheet for each sample, each of these should be clearly identified so that it can be associated with the batch from which it was taken. Aim to post early in the week to avoid samples being in the post over the weekend.
The silage report you receive back from the lab will provide a host of information on the feed value and preservation of your silage. This will not only inform your feeding plan but also potentially some key areas to focus on for silage harvesting. The detail contained in Table 1 summarised the key information provided from silage analysis and highlights some useful guidelines to assess your sample. Contact your local advisor to discuss this further and help draw up a feeding plan for your flock this winter.
Table 1: Key information provided from silage analysis
| Unit of measure | Meaning | Low | High | Quality best when |
|---|---|---|---|---|
| Dry matter (%) | Feedstuff less water content | 13-17 | 40-55 | Medium |
| pH | Measure of acidity | 3.4-3.7 | 4.5-5.5 | Medium to low |
| Ammonia – NH3 (% N) | Indicator of grass N content at cutting (Different to crude protein below) | 4-7 | 15-25 | Low |
| NDF (% DM) | Measure of forage fibre and intake potential | 42-47 | 55-65 | Moderate to low |
| DMD (%) | Measure of quality | 55-65 | 76-80 | >72 |
| ME (MJ/kg DM) | Energy content (linked to DMD value) | 8-9 | 11-12 | High to moderate |
| UFV (unit/kg DM) | Energy content (linked to DMD value) | 0.6-0.7 | 0.89-0.96 | High |
| Crude Protein (% DM) | Measures N as an indicator of true protein content | 7-9 | 15+ | Moderate to high |
| Ash (% DM) | Indicator of soil contamination | 5-6 | 12-15 | Low to moderate |
