06 February 2025
Don’t mine away valuable soil fertility levels
Getting the soil fertility basics right, such as optimising soil pH and applying phosphorus (P) and potassium (K) in a balanced programme, is a key part of all economically and environmentally sustainable production systems, writes Veronica Nyhan, Soil and Plant Nutrition Specialist.
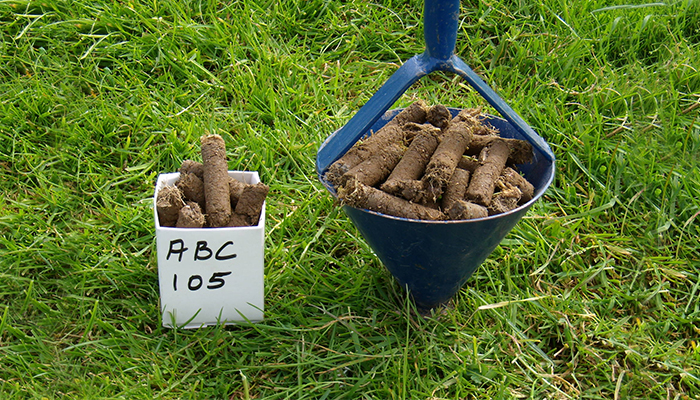
Soil testing is a crucial and low cost technology that enables the strategic application of fertilisers and organic amendments to crops. Applying the right source of nutrients, at the right rate and the right time to the right place prevents nutrient loss to water, reduces greenhouse gas emissions and protects soil biodiversity.
Due to the rise in fertiliser prices in 2022, the national consumption of nutrient P and K in the form of chemical fertiliser both dropped by over 33% between 2021 and 2023. While K usage in 2024 rose 7.5% on the previous year, P has dropped a further 6.6%. Controlling fertiliser costs, while critical to farm profitability, should not be at the expense of mining valuable soil fertility levels.
Soil fertility database
Teagasc maintains a database of soil test results analysed annually to monitor pH, P and K soil fertility trends over time on a national and county by county basis, for each of the principal farm enterprises. The Teagasc Soil Fertility Report provides an overview of the data analysis for the given year and contains a number of graphs showing trends in all soil samples analysed since 2007.
However, it is important to remember that the target nutrient indices on marginal and biodiverse rich swards are not necessarily the same as for highly-productive systems with high offtakes. Decisions related to nutrient management need to be taken with the output requirements and ecological value of the habitat in mind.
National results
In 2024, Teagasc analysed a total 69,471 soil samples, of which 92% represented grassland samples. The following is a summary of the main changes for soil pH, P and K in 2024.
National Highlights
- The overall number of soil samples analysed dropped by 7.5% on 2023 with the decrease coming from the dairy and tillage sample set
- A slight improvement in soil fertility on 2023 with soils at optimum fertility increasing to 17% (+2%)
- Soil pH saw an improvement with 47% of soils analysed testing with >pH 6.2 (+2%)
- Soil P levels at Index 1 and 2 decreased to 49% (-1%)
- Soil K levels remain similar with a slight decrease (-1%) in soils at K index 1 and 2
Breakdown by enterprise
While on a national level, soil fertility trends changed little in 2024, on an enterprise level the data showed some noticeable differences. Samples taken from the dairy sector, in particular, showed substantial improvements on the results recorded in 2023 which was consistent across all parameters tested. This may be a consequence of improved liming, P build up allowances or the enhanced knowledge transfer through mandatory derogation training requirements to this sector over the last number of years now showing dividends.
However, according to these results, over one third of the 2024 dairy sample set is in index 4 for P. These high index soils, can pose an environmental threat. The high fertility will supply the P needs of the crop for the year ahead, reducing input costs and providing the opportunity to strategically divert organic and chemical P applications to the low index soils building whole farm fertility.
Enterprise Highlights
Dairy
- 24% of soils have optimum pH, P & K (5% increase)
- 61% of soils with a soil pH >6.2 (9% increase)
- 37% of soils at P index 1 and 2 (9% decrease)
- 38% of soils at K Index 1 and 2 (6% decrease)
Drystock
- 11% of soils have optimum pH, P and K (1% decrease)
- 38% of soils with a soil pH >6.2 (2% increase)
- 53% of soils at P index 1 and 2 (1% increase)
- 47% of soils at K Index 1 and 2 (2% increase)
Tillage
- 20% of soils have optimum pH, P and K (no change)
- 62% of soils with a soil pH >6.5 (1% increase)
- 55% of soils at P index 1 and 2 (1% increase)
- 33% of soils at K Index 1 and 2 (6% decrease)
For further details, the Teagasc Soil Fertility Report 2024 is available to download (PDF) here.