22 November 2023
57% of farms earned less than €20,000 in 2022
Teagasc economists have released the final figures from farm incomes in 2022 based on the Teagasc National Farm Survey (NFS). The results are representative of over 85,000 farms nationally.
Presented in the form of Family Farm Income (FFI), which represents the return from farming for farm family labour, land and capital, the NFS also provides a breakdown of the distribution of Family Farm Income in 2022.
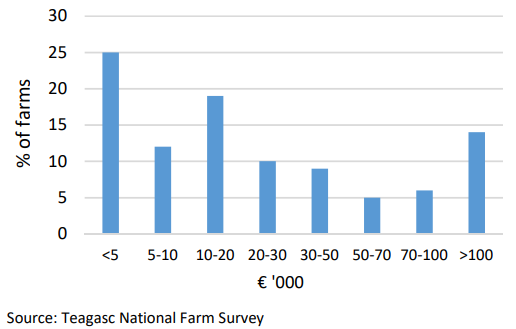
Last year, 25% of farms represented in the survey (across systems) had a farm income of less than €5,000 (Figure 1). A further 12% earned between €5,000 and €10,000, with an additional 19% reporting an FFI of between €10,000 and €20,000. Therefore, 57% of farms earned less than €20,000 in 2022.
In terms of the remaining farms with incomes above €20,000 in 2022, 10% earned between €20,000 and €30,000, with a further 9% earning between €30,000 and €50,000. Of the remaining farms, 5% earned between €50,000 and €70,000, with 6% earning between €70,000 and €100,000. In 2022, 14% of farms earned in excess of €100,000. Compared to 2021, there was an increase in the proportion of farms that fell into higher income categories in 2022. This reflects the improvement in average farm income that was observed in 2022 on dairy and tillage enterprises in particular.
Figure 1: Average FFI distribution 2022
Conversely, looking specifically at the drystock systems, there was a move towards the lower income categories, given the decline in cattle rearing and sheep FFI. Figure 2 presents the distribution of aggregate FFI by system in 2022.
Figure 2: Distribution of aggregate FFI by farm system 2022
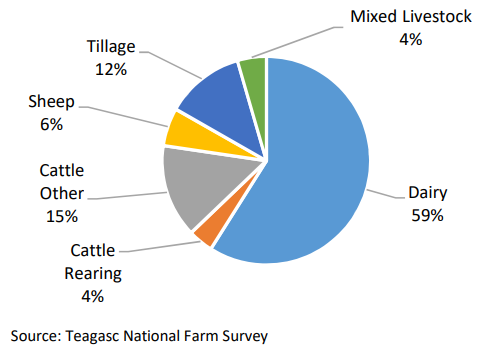
Although dairy farms account for only 18% of the total farm population represented. These farms were responsible for 59% of the total farm income generated (€2,276m) in 2022. The equivalent portion of farm income accruing to the two cattle farm categories was 18% (€710m), although cattle farms account for 56% of the total farm population represented.
Sheep farms account for 16% of the total farm population represented and 6% of farm income (€228m) in 2022. Tillage farms account for 7% of farms overall, but generated 12% of total FFI (€475m) in 2022. The remaining 4% of farm income accrued to the so-called mixed livestock farms, which for definitional reasons do not fall into any one of the other system categories.
Income across farm categories
Across the various farm systems, the contrasting story in terms of farm income distribution is evident in Figure 3. It is worth noting that 88% of dairy farms reported an average FFI of more than €50,000 in 2022, with 61% of these earning more than €100,000.
On the other hand, 66% of cattle rearing farms earned a farm income of €10,000 or less in 2022, on average (up from 58% in 2021). A total of 42% of cattle other farms recorded an average FFI of €10,000 or less in 2022, unchanged from the previous year. In 2022, 51% of sheep farms recorded an average FFI of €10,000 or less, up from 42% in 2021.
Figure 3: Average farm system FFI distribution 2022
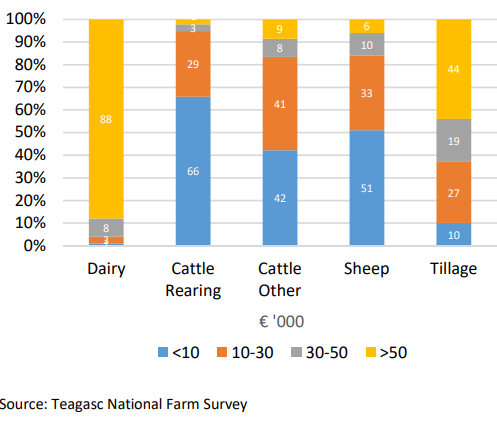
In 2022, 29% of cattle rearing farms earned between €10,000 and €30,000. The comparative figure on cattle other farms was 41%. On tillage farms, 10% reported a FFI of €10,000 or less in 2022 (down from 15% in 2021). A total of 27% of tillage farms reported an FFI of between €10,000 and €30,000, with 19% earning between €30,000 and €50,000, and 44% earning more than this in 2022.
Unpaid family labour
It is important to take account of unpaid family labour on farms, given that the amount of such labour required can vary considerably by farm type. On average, there was just over one unpaid family labour unit (or annual work unit) employed across all farm types in 2022
The amount of unpaid (family) labour supplied was highest on dairy farms, averaging 1.45 labour units, and lowest on cattle other farms, averaging 0.90 labour units. Tillage farms had an average of 0.92 family labour units in 2022, with comparative figures on cattle rearing and sheep farms of 0.92 and 0.99 labour units, respectively.
In terms of total labour units (including additional hired labour), the average dairy farm in 2022 had 1.81 labour units. The comparative figures on tillage farms were next highest at 1.05 and sheep farms at 1.03. On average, the cattle farm systems reported total labour units below 1, at 0.94 for cattle rearing and 0.93 for cattle other. These farm holders are generally more likely to supplement their income by also working off-farm.
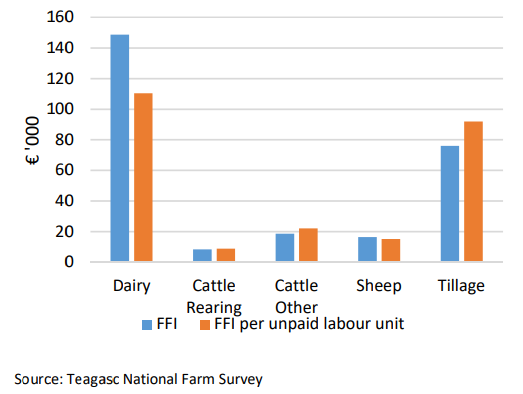
Figure 4 reports average FFI per farm and an adjusted FFI per unpaid labour unit in 2022. In adjusting for the additional unpaid labour utilised on dairy farms (1.45 labour units on average), FFI per labour unit was estimated to be €110,359.
Across the cattle systems, as less than one family labour unit was employed, the labour adjusted FFI is above the average FFI figure reported. On sheep farms, when FFI is adjusted for the fact that the average farm employed approx. one family labour unit, the figure is below the average FFI reported at €15,094 in 2022. Additionally, on the average tillage farm, hired labour and contractor use are more predominant and when FFI is adjusted for unpaid labour the FFI figure is revised upwards to €91,935.
Figure 4: Average farm system FFI per unpaid labour unit 2022
This article was adapted from the Teagasc National Farm Survey 2022 report. Access the report here. Teagasc economists have also prepared Enterprise Factsheets, which provide a detailed breakdown of production costs and a range of farm technical performance measures for 2022. These can be viewed here.
Also read: Teagasc releases indicators of farm technical performance
Also read: What sets the top and bottom performing sheep farms apart?